
Introduction
You can arrange your dashboard however you would like by easily dragging and dropping the widgets in whichever order you like, so you can prioritise what you want to see first. This layout is user specific, allowing a manager to prioritise features such as “Opportunity Projections”, whilst a salesperson can prioritise features such as your “To-do List”.
Note: If there are particular widgets you do not want to be shown (for a particular user, or company wide) please let us know and we can remove it for you.
The To-do List
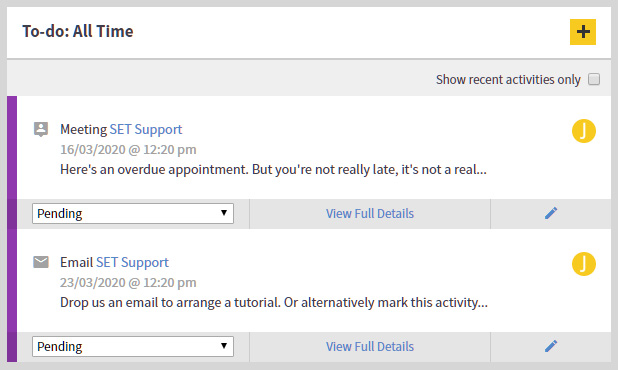
Check this widget for a look into your daily activity workload. Your activities displays the list of activities which are due to be completed today. You can complete activities using the drop down shortcut in this widget, or edit each activity individually by clicking on the pencil icon next to each task.
By deselecting the box “Show recent activities only” you’ll be able to view your overdue activities, as well as those which are due today.
You can also create new activities from here, by clicking the yellow “+” button in the top right of the widget. For more info on creating activities, click here.
Contact expiry
Keep an eye on your GDPR compliance with these handy counters, that show when your rights to hold contact information are due to expire.
Provides a summary of how many of your contacts have expired, are expiring within 7-30 days and contacts that have no expiry date set. The feature is used to be GDPR compliant and ensures your customers are regularly updated.
Contacts
Get a feel for how well your team is acquiring and qualifying your fresh leads with this pie chart and counters.
Pipeline activity
This widget provides a snapshot of each of your pipelines, showing you how many active opportunities are within each stage and the total value of each. To switch between different pipelines click the golden drop down arrow under the pipeline name section and choose between your available pipelines.
Sales targets
Sales targets can be assigned to various users in the system, and this widget differs for each user depending on whether they are an Admin (manager) or standard user (salesperson). The Admin user who assigns these targets is able to view how much of the current target has been met by each user. The standard user in SET, who has been given a target by a manager or team-leader, can see a pie chart showing their current progress on the target they have been assigned in this widget.
Sales targets can be assigned in the settings area in SET, and can be annual, quarterly or monthly.
Opportunity Projections
In the Opportunity Projections widget you are able to view the projected revenue which will be generated by your SET Opportunities. Based on your confidence level, this widget is able to differentiate between the business you are likely to win, and your total possible income. You also have the ability to filter this widget down to different time periods, as well as being able to measure your projections through “Gross Profit” or “Total Income Value”.
Opportunities Won & Lost
This widget provides you with details of how many of your opportunities have been ‘won’ or ‘lost’ within a certain time frame. The amount of time can be broken down by quarters by clicking on the drop down filter.